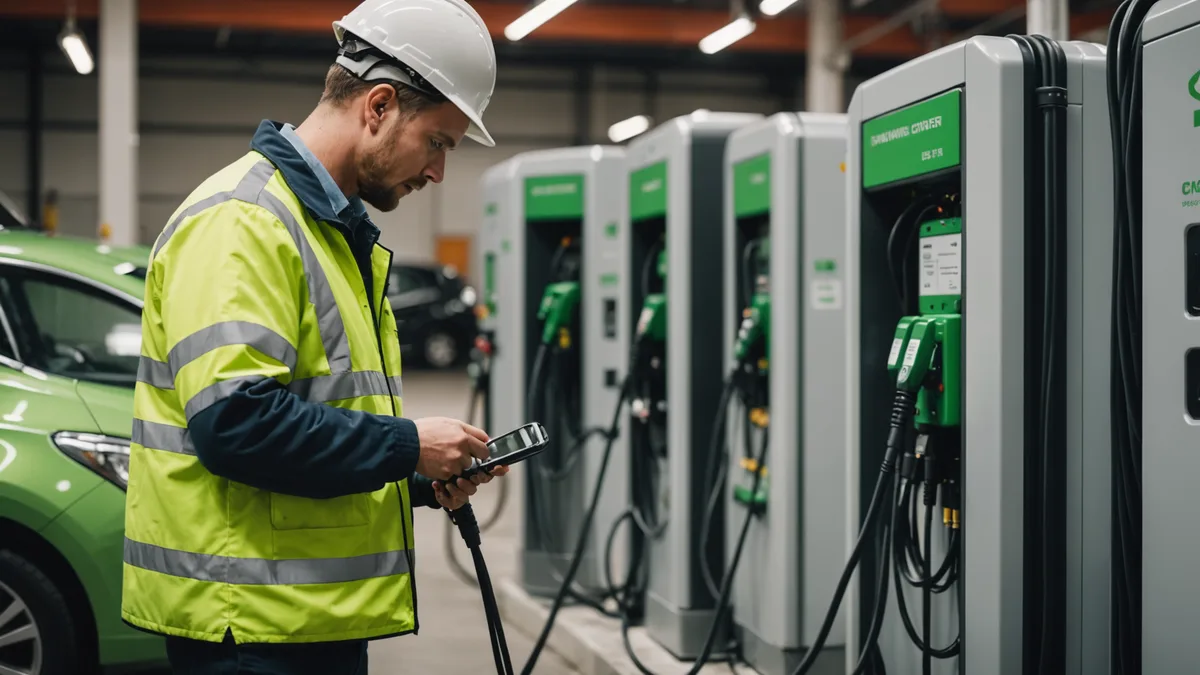
At 2:47 AM on Wednesday, one of 24 AC wall-box chargers at a commercial campus near Electronics City lost its OCPP WebSocket connection. The unit was physically sound, with no tripped breaker. Its network interface rebooted after a firmware watchdog cycle, but manufacturer reconnect logic imposed a 30-minute backoff. At 6 AM, three morning-shift drivers saw a red fault LED and assumed the charger was broken. Two called the property manager. One left without charging.
The incident may have cost Rs 600 in missed sessions. It also produced a support ticket, an annoyed property manager call, and a small reputation hit at a site we were trying to grow. The charger was "down" for under four hours, appeared in no automated report, and was found only because we compared session completion with expected morning volume.
That is the practical uptime problem: not broken hardware, but the interval between a fault occurring and someone learning about it.
What "Uptime" Means in Operations
The EV industry uses uptime inconsistently. Some vendors count time in the Available or Charging OCPP state. Others count session attempts that finish successfully. These measures differ, and each leaves something out.
For our pilot network operators, uptime has two measures. Connector availability is the share of scheduled operating hours when a connector is not Faulted, Unavailable, or unreachable. Session completion rate is the share of initiated transactions, where a driver used a card or QR code, that delivered energy and ended with a clean StopTransaction message. The first measures infrastructure health; the second measures revenue integrity.
Across 20 to 60 chargers, operators often see 88% to 96% connector availability without active monitoring. With systematic monitoring and a response protocol, 95% is a realistic, sustainable floor. Above 97% generally needs very new hardware, very fast responses, or both.
Four Failure Categories to Track
In our pilot network, charger downtime falls into four categories. The category determines the appropriate response.
OCPP connectivity loss means a physically working charger has lost its WebSocket link to the central system. It is our most common issue, at roughly 40% of availability events. Causes include exhausted SIM card data on cellular units, IP reassignment on shared Wi-Fi, and the firmware backoff-timer issue above. Detection is simple: a charger is unreachable if it sends no Heartbeat within 2x its configured HeartbeatInterval. Response matters because these faults may self-resolve within 15 to 60 minutes when the network issue clears, yet can last days if nobody notices.
Physical fault events include ground faults, GFCI trips, contactor failures, and connector latch errors that place a connector in Faulted status and need physical intervention. They make up about 25% of our availability events. Most need a site visit, but around 30% clear through a remote soft reset using OCPP ChangeAvailability or Reset commands. Try the remote reset before dispatching a technician.
Payment processing failures occur when a session starts but authorization cannot finish because the payment gateway is unreachable or returns an error. With OCPP 1.6, an offline CSMS authorization can deliver energy if a failed gateway call goes unreported, leaving no confirmed payment record. The result appears as a settlement-report revenue discrepancy, not a charger fault.
Power supply interruptions include grid outages, building breaker trips, and DISCOM demand curtailment. Operators cannot control them, but should log them because they affect uptime metrics and the DISCOM relationship.
The Monitoring Stack for 95%
Achieving 95% is largely an alert-latency exercise. Each hour a faulted charger goes unnoticed adds missed sessions, driver complaints, and churn among high-value users, including drivers who charge daily.
For any network with 15 or more chargers, we recommend three minimum signals. First, a heartbeat watchdog flags a charger with no Heartbeat or OCPP message within 3x its HeartbeatInterval. At 90-second intervals, detection takes 4.5-minute lag. Second, a session-start anomaly flags a connector that moves from Available to Preparing but sends no StartTransaction within 5 minutes. This catches "connector stuck in Preparing" faults. Third, compare expected sessions with completed transactions by site over 2-hour windows. A significant below-baseline drop can signal payment gateway trouble or wave-mode failures, when several chargers fault together.
Next, add a daily fault-frequency report for each charger. A unit that faults and self-recovers 8 times in one week may be signaling hardware failure, even while its current state is Available.
Response Protocol: Raising Uptime
Monitoring without a response protocol is only a dashboard. Operators in our pilot network sustaining 95%+ uptime share one habit: a defined escalation path and a maximum time-to-acknowledge for every alert type.
For OCPP connectivity-loss alerts, we use a 2-hour SLA to acknowledge and try remote remediation, such as a soft reset or firmware restart through OCPP UpdateFirmware if available. For physical faults that survive remote reset, a 24-hour SLA for technician dispatch is reasonable for AC units. DC fast chargers warrant faster action because they contribute more revenue per charger.
We are not arguing that every operator needs a 24/7 NOC. We are saying small networks can use a morning review cadence for most alert types. "Morning review" must not mean "morning discovery": alerts should fire in real time and reach someone, even if action waits until 9 AM the next day.
Metrics That Expose Systemic Problems
Individual charger uptime may look healthy while a system-wide issue develops. The earliest useful measure is session completion rate by site, not charger. Four chargers may each show 95% availability while site completion is 82%, indicating a shared network switch, an expiring payment gateway credential, or power-quality trouble across the bay.
Fault-frequency trend is the second leading indicator. A charger rising from 1 fault event per week to 4 fault events per week over 30-day period signals hardware degradation. Preventive maintenance or vendor contact costs less than an emergency callout after total failure.
At 95%, the tradeoff is plain: consistent alert detection and response matter more than chasing hardware quality, separating operators at 95% from those remaining at 88%.